
Quick, did you know that when Dwyane Wade eats pancakes for breakfast, plays on the second Monday of the month and is caught walking into the arena wearing manpris that he actually shoots 17% better than his average?
Here’s another little something you might now know. I just made that shit up. But for a second there you probably thought it was an actual little factoid I picked up somewhere. Welcome to the stat-crazed, Hollingerized sporting world we live in today. Now, for those of you who have taken a cursory glance at this here nugget of the web I call home, you know that I’m not much of a stat guy. Partially because I’m shitty at math, but mainly because numbers don’t always tell the whole story.
A quick look back at Game 2 of this year’s NBA Finals shows us that LeBron James finished with by his standards, an unremarkable 17-8-7. What the numbers don’t show, is how much better James’ tempo and spacing was versus Game 1. How many more times he set up his teammates for quality looks. How much more aggressive he was in attacking the Spurs that left their defense vulnerable. Or how many times he sucked all the air from the arena with momentum-stuffing plays, including a block that fucking devoured Tiago Splitter’s soul.
So while James’ numbers in Game 2 weren’t particularly amazing, the effect he had on his team winning (which they did convincingly by 19) was much greater than what the box score would imply. And that’s just the thing about statistics. They can be deceiving when taken just at face value. On one end of the spectrum, you have LeBron James and his Game 2 performance. On the other, you have players who routinely score lots of points, grab rebounds, make All-Star games, get shoe deals and in general, are very talented players. There’s only one problem.
None of it translates to a goddamned thing in the win column.
These are what I call empty calorie players. If there was a Hall of Fame for empty calorie players, the first inductees would be Tracy McGrady and Glibert Arenas – two players defined by impressive career numbers that for one reason or another, consistently landed their teams in the draft lottery. But before we list our All Stars, let’s first lay down some ground rules.
THE CRITERIA
Minimum of 5 years experience
Rookies are automatically off limits since they haven’t demonstrated any real patterns quite yet. Not to mention, they really have no clue what they’re doing that first year anyway. Likewise, teams with star young players (Kyrie Irving and John Wall for example) are usually in position to draft those players because, well, they’re a terrible basketball team. Meaning most star young players are the lone playmakers for a few years before the team can put other pieces around them.
Must be a cumulative top-20 scorer over the last 5 years
How did I come up with top 20? I don’t know. Seemed appropriate. But here’s how I look at it. If they were in the top 30, one could argue that among the league’s 30 teams, that player is likely to be the best scorer for their respective team (unless that team featured two top 30 scorers in which case the next criteria almost certainly would not be met). As a top 20, that means they’re not just their own team’s best scorer, but better than 30% of the rest of the league’s best.
Team must have a cumulative winning percentage of .500 or below during that time
This is where things all get tied together in a neat little bow. Obviously, winning 50% of your games in the NBA is good enough for the occasional playoff berth. But it also seems a little underachieving to be among the league’s best scorers over five years and still be unable to win half your games. By using a five year sample size, we’re able to see more of a proven track record without the occasional aberration winning year impacting things too much.
Alrighty. Onto our starting lineup.
Deron Williams

SCORING POSITION AND AVERAGES (2008-2013)
32nd – 19.4ppg
27th – 18.7ppg
21st – 20.1ppg
11th – 21.0ppg
15th – 18.9 ppg
Average position: 21
TEAM WINNING PERCENTAGES (2008-2013)
.585
.646
.476 (majority utah)
.333
.598
Average win percentage: 52%
Okay fine, I’m breaking my own criteria right off the bat, but it’s just this once. Well, kinda. The reason Deron Williams is here is twofold. First, his numbers are still awfully close to the cutoff line, coming in at just over the 20th leading scorer over the last five years, and his teams winning just over 51% of their games. But the main thing that lands Deron Williams here is that Deron Williams gets fucking PAID. If you recall, Williams signed a five-year extension worth $100 million dollars last year. Also, remember when Deron Williams VS. Chris Paul was a thing? That was cute. Bottom line is, if you’re giving a guy a max deal worth nearly $25 million a season, he should be able to deliver wins more than half the time.
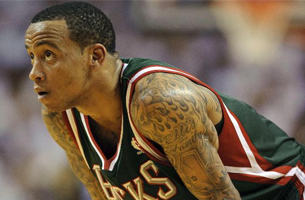
Monta Ellis
SCORING POSITION AND AVERAGES (2008-2013)
34th – 19.0ppg
6th – 25.5ppg
8th – 24.1ppg
15th – 20.4ppg
13th – 19.2ppg
Average position: 15
TEAM WINNING PERCENTAGES (2008-2013)
.354
.317
.439
.348 (majority Golden State)
.463
Average win percentage: 38%
If there’s a modern day poster child for empty calorie players, Monta Ellis is him. I personally watched Ellis the last season and a half during his time in Milwaukee and honest to goodness, I questioned whether Ellis knew there were four other players on the floor with him at times. As you can see, Ellis’ scoring numbers (on paper anyway) look impressive, dropping nearly 20 ppg for the last five seasons. But his teams just suck. I mean, really suck. I’m just glad as a Bucks fan they didn’t do something crazy and offer him a contract extension this week. Wait…
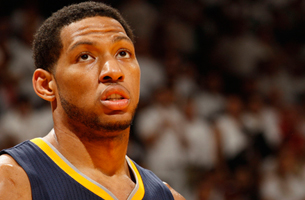
Danny Granger
SCORING POSITION AND AVERAGES (2007-2012)
34th – 19.6ppg
5th – 25.8ppg
8th – 24.1ppg
17th – 20.5ppg
27th – 18.7ppg
Average position: 18
TEAM WINNING PERCENTAGES (2007-2012)
.439
.439
.390
.451
.636
Average win percentage: 47%
Since Granger was injured nearly all of this year, we’re taking another slight liberty and looking at Granger’s numbers starting in 07 and going through last season. And, well now. In the midst of Roy Hibbert being tall and Paul George becoming mini-Bron this year, it’s tough to remember that before this year, Granger was kind of a beast. Just look at that 08-2010 stretch. Make no mistake, Indiana, should they try to trade Granger this off-season or during next year, will use those numbers to sell other teams on his potential. Either that, or they’ll keep him to scare the shit out of Miami.
Al Jefferson

SCORING POSITION AND AVERAGES (2007-2013) (2009-2010 season not included)
22nd – 21.0ppg (07/08)
8th – 23.1ppg (08/09)
29th – 18.6ppg (10/11)
20th – 19.2ppg (11/12)
25th – 17.8ppg (12/13)
Average position: 20
TEAM WINNING PERCENTAGES (2007-2013) (2009-2010 season not included)
.268
.293
.476
.545
.524
Average win percentage: 42%
Big Al tore his ACL about 2/3rds of the way through the 08-09 season, so as his first year back and still recovering from the surgery (along with other nagging injuries including a sore achilles) we’re discounting the 09-10 season. As a result he checks in right at the 20th highest scorer. Impressive considering most people wouldn’t recognize him if he walked into a mall wearing his own jersey (Which by the way, I always thought would be a great stunt for a popular pro athlete to pull. Would people think it’s really him, or just some douche who looks like him trying to play the part? The latter is my guess). Anyway, the problem is that even though Al’s scoring proficiency is considerable, his ability to turn that into wins, isn’t. Case in point, Al Jefferson in the last six years has played in the playoffs exactly ONCE.
Kevin Martin
SCORING POSITION AND AVERAGES (2007-2012)
7th – 23.7ppg
7th – 24.6ppg
17th – 20.6ppg
9th – 23.5ppg
36th – 17.1ppg
Average position: 15
TEAM WINNING PERCENTAGES (2007-2012)
.463
.207
.408 (SAC & HOU combined)
.524
.515
Average win percentage: 42%
I know. Kevin Martin (Kevin Martin!) is on this list. If you’re unfamiliar with Martin, he’s the guy Sacramento and Houston have essentially been playing patty cake with for the last six years. That is, until the Thunder decided to take him in a trade in which they gave up the league’s 5th best scorer. Ouch. To make this list however, we once again had to look a year back and judge Martin from 07-2011/2012 since he was relegated to bench duty with Oklahoma City. But before that, it’s easy to see why Martin was consistently viewed as such a valuable trade chip. Granted, Martin, unlike the rest of the guys on this list, was never been asked to be “The Guy” on his team. But still, you don’t luck into four straight seasons of 20+ ppg. Those are legit numbers. And the teams he played on, were legitimately terrible in every definition of the word.
Honorable Mentions (Who I thought would make the cut, but didn’t):
Carmelo Anthony (win pct. too high)
Josh Smith (ditto)
Joe Johnson (ditto)
LeMarcus Aldridge (EXTREMELY close, but just a bit beyond Deron Williams’ numbers)
Dwight Howard (not enough scoring, too douchey)
Tyreke Evans (not enough scoring, but well on his way)
Amar’e Stoudemire (was actually worth a shit in Phoenix and first year in New York)
